8 decisions that can make or Break your next Data Science Project

Have you already undertaken a Data Science project? Are you looking to get into the field and hit the ground running? Here are some of the more important things you need to consider while getting into the field, building your brand, or expanding into different domains and markets.
Pre-Sales
A project doesn’t start with acquiring data and building algorithms. The pre-sales stage needs to be given equal importance in order to lock in a project for yourself.
- Manage expectations correctly – While performing pre-sales activities, even though you are trying to sell the product by making it look as good as possible, you can’t oversell it. You need to put yourself in the shoes of the actual data scientists delivering the product and think about what you promise to a potential client.
- Do you promise 98% accuracy when the industry maximum is 86%? You can’t have promising results when you’re potentially setting up your data science team to fail.
- This can be improved by having close collaboration between technical and non-technical personnel in a business. This makes it easier for the salesperson(s) to be more aware of what is and isn’t possible on a technical level and manage expectations for the data scientists to indicate that mediocrity will not be acceptable.
- Decide your metric(s) for success – Promising a high value of accuracy is not always the best idea. Say you promise the client 90% accuracy while predicting weather in a specific region at a particular time. Say you deliver on your promise, too. Then what? How do you proceed from there? Understanding how your predictions translate into success and defining the end goal is crucial in these scenarios.
- The metric for success isn’t always getting high accuracy. You need to go a step further to help your client. Providing consulting to make essential business decisions and how predicted data should influence those decisions can go a long way in building your reputation. This ties into my next point as well –
- Identify real-world benefits – Understand the correlation between predicted data and actual future results. Consider the following use case: You expect future product sales (distribution and retail) for a certain company in 30 different markets. Using your predictions for the next 4 quarters, you advise the client to move more of their salespersons to the top 5 markets which emerge from your predictions.
- However, you need to realize that if those markets tend to provide good numbers in the future, those could be due to your manual intervention and moving more people there. You could improve sales of any 5 markets by diverting people there and focusing your attention on those markets. Data science could have provided the benefits you gained in this case.
- Choose the right depth of analytics – The well known 4 levels of analytics are : descriptive, diagnostic, predictive and prescriptive. These increase in both difficulty and value, and provide you hindsight, insight, or foresight, based on the depth you select.
- Generally, we aim for prescriptive analytics to provide us better foresight, even when our data isn’t mature enough or can’t provide us with that. It could be worth it to limit your scope to hindsight for a while until your data matures and you get to a level where you can employ prescriptive analytics.
Data Selection and Preprocessing
Does your client have a massive data store? Or do they have a minimal scattered amount of data that needs work before it can be used effectively? Here are some of the steps you may need to take before you can run algorithms on the data.
Manage and organize data stores – If the client’s data is not organized and/or is too much to effectively use right away, you may need to perform intermediate steps first. Consider that the client has their data in the following data stores –
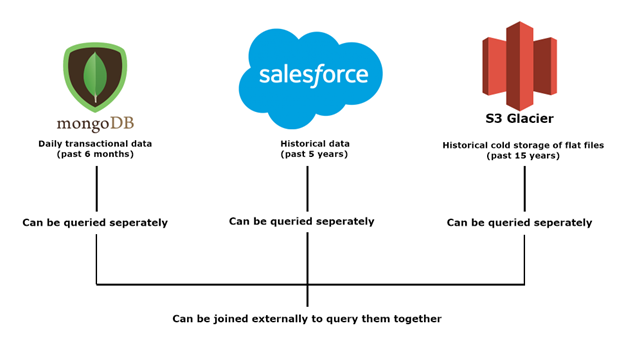
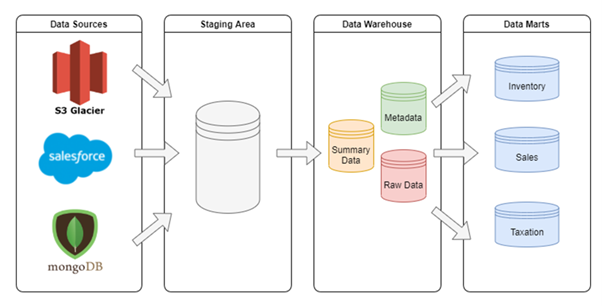
In this case, the client’s data is split across several sources. This is pretty normal, and occurs at varying different levels of scale. Now, consider an additional step before the data is used for any Data Science work – This step would involve creating a data warehouse and data marts to query and join data effectively. The data marts would be based on different lines of business and upstream use cases. It would also ideally be scalable to make up for future data.
- Make sure the data you are using is not inferred directly from what you are predicting – In other words, if certain features or columns are inferred from the value you are predicting, those cannot be used for prediction. Also, if what you are using to predict is not available at the time of prediction, eliminate that from your dataset.
- Consider the following scenario – You are trying to predict flight delays at the destination, 24 hours before the flight takes off. Using predicted weather, location details, etc. is all well and good, and it would help your algorithm. However, if the historical data contains a column with more information on the flight delays at the source, those cannot be used as a feature since they’re not available at the time of prediction.
Feature Selection
Once you’ve selected all the relevant data for your algorithm, you need to ensure what you’re using actually contributes to your goal. This could take the form of 2 problems – Not having enough features, or having too many features.
- Proper feature engineering – Make sure you are employing enough methods to extract additional information from the (possibly limited) selection of features in your original data. These include, but are not limited to –
- Numerical
- Add rolling window features.
- Add expanding window features
- Add lags (values of variables on the previous day, previous month, etc.)
- Add trends (change in variables over certain periods)
- Binning data
- Power transformations (sqrt, log, box-cox)
- Normalization (min-max, z-score, log, linear)
- Temporal
- Month (can be further processed as a categorical feature)
- Part of day (4/6/8-hour intervals)
- Weekend flag
- Holiday flag
- Categorical
- One-hot encoding (best with nominal data, where categories don’t have any underlying order)
- Encode from categorical to numerical (best for ordinal data, where categories do have underlying order)
- Text
- TF (Term Frequency) or TFIDF (Term Frequency Inverse Document Frequency)
- Using NLP libraries like SpaCy to perform lemmatization, tokenization, grammatical error corrections, etc.
- Cosine similarity for document matching
- Topic Modeling
- Document Clustering
- Count mentions/hashtags when processing twitter feeds
- Location
- Altitude
- Distance from the coast
- Weather features (if the data contains date/time features)
- Proper feature elimination Too many features can add noise to the model, and worsen your results. You can perform the following steps to pick/eliminate features –
- ACF (Autocorrelation Function) and PACF (Partial Autocorrelation Function) plots can be used to determine which lagged features should be used.
- PCA (Principal Component Analysis) can reduce dimensionality while minimizing information loss.
- RFE (Recursive Feature Elimination) can be used to remove features that aren’t contributing to accuracy.
- Use correlation/chi-square tests to eliminate features.
- Numerical
On a departing note, most of these above points need additional time and effort. However, they are all worth spending time on since they can make or break your project. Ultimately, it comes down to prioritizing speed in a PoC or leaving no stone unturned in a full-fledged project.
~ Riaz Moradian
Senior Consultant